
How to Read a TradingView Chart: A Beginner's Guide
Open a TradingView chart for the first time and it can look like a wall of green and red bars, lines, and numbers. Every beginner feels the same way. The good news is that a chart is built from a small number of simple parts, and once you understand those parts, the rest starts to make sense. You do not need to learn every indicator. You need to learn how to read price, time, and volume, and how to check a few tools that confirm what price is already telling you.
Candles: The Basic Building Block
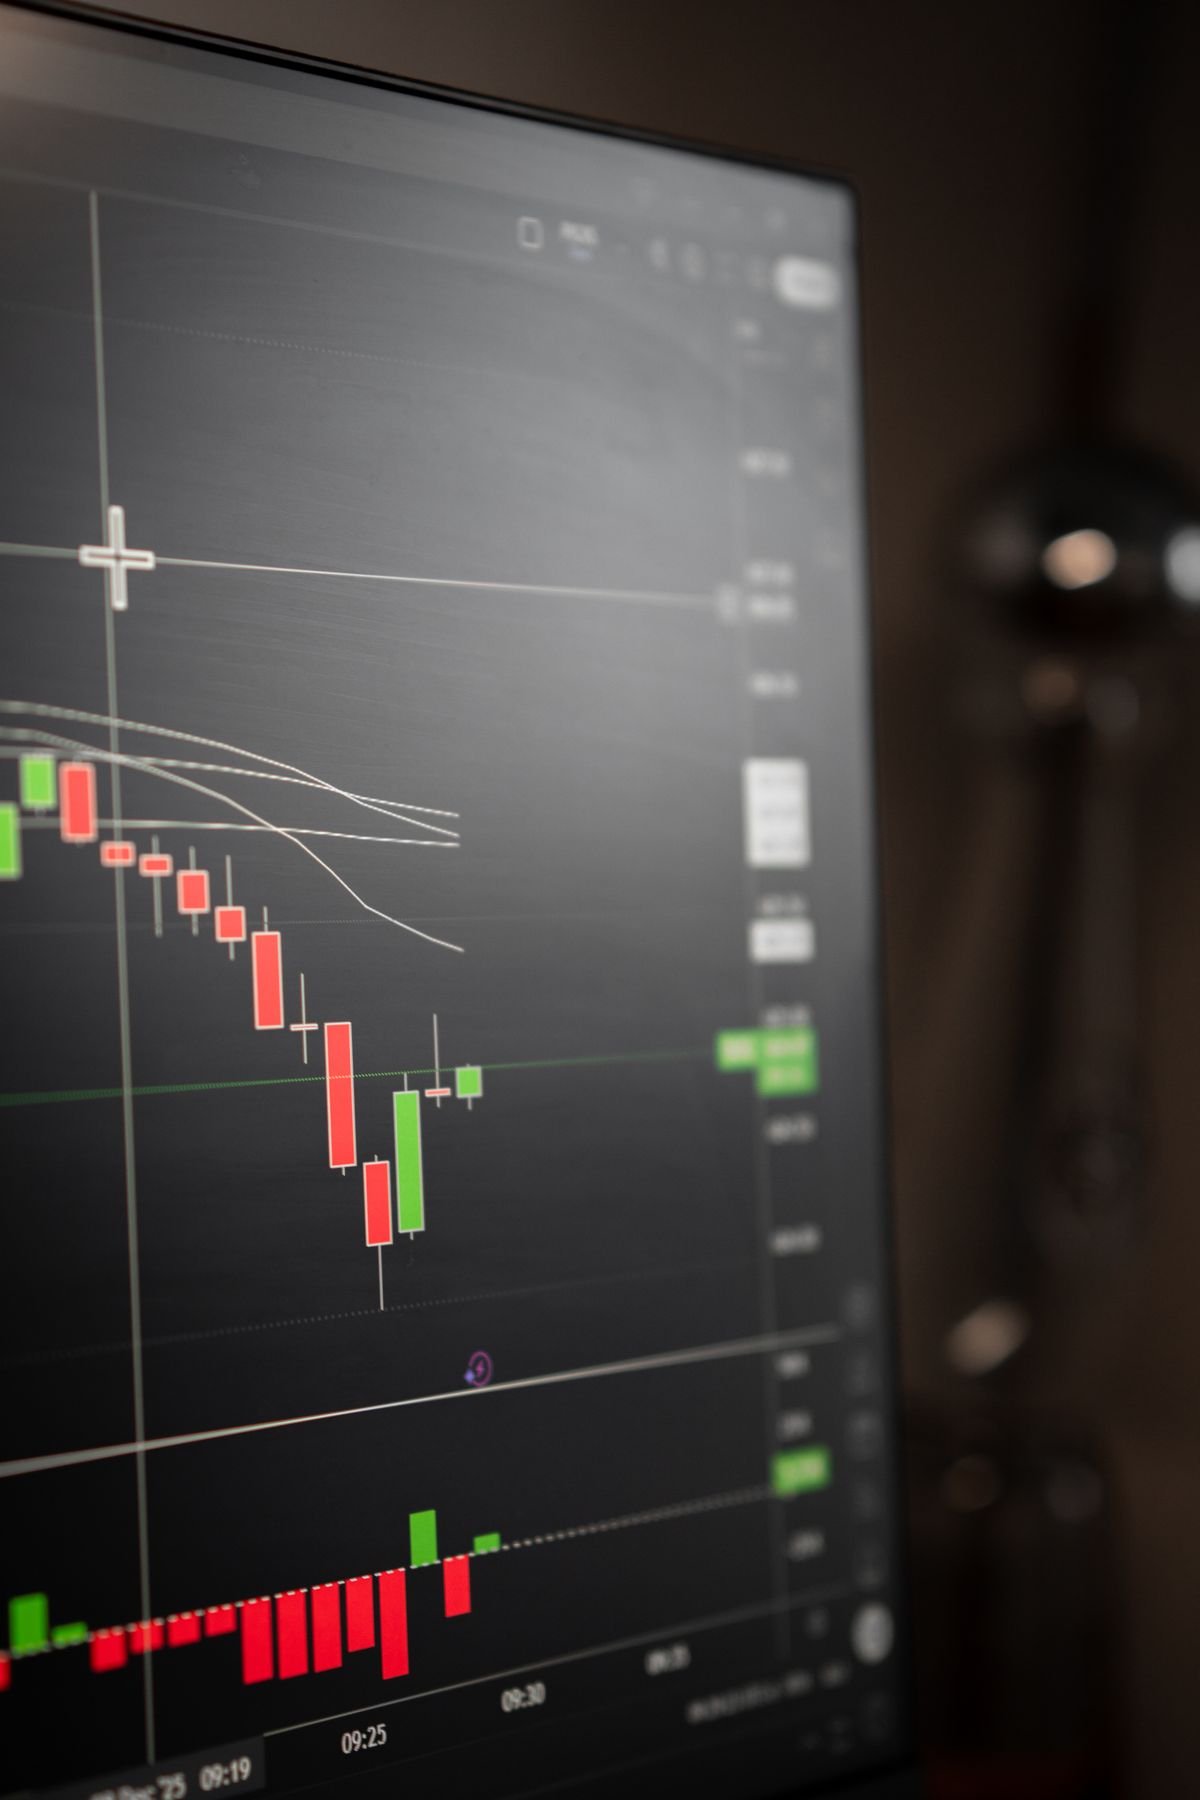
Most crypto charts use candlesticks. Each candle represents one period of time, and it tells you four prices: the open, the high, the low, and the close. A green candle usually means the price closed higher than it opened in that period. A red candle usually means it closed lower. The thick part of the candle is called the body. The thin lines above and below it are called wicks, and they show how far the price went up or down during that period before closing.
A long green body means buyers were strong during that period. A long red body means sellers were strong. A small body with long wicks means the price moved a lot but ended close to where it started, which often shows indecision. You do not need to memorise dozens of candle patterns. Start by asking a simple question for each candle: who was in control, buyers or sellers, and by how much?
Timeframes: The Same Chart, Different Stories
A timeframe is the length of time each candle covers. On a 1-hour chart, each candle is one hour. On a 1-day chart, each candle is one day. On a 30-minute chart, each candle is 30 minutes. The same coin can look completely different on different timeframes. It might be rising on the daily chart but falling on the 15-minute chart. That is normal, and it is why traders check more than one timeframe.
A common approach, used in the Sir Noman Method course on Scalprbot, is to check the bigger timeframe first to understand the main trend, then use a smaller timeframe to time an entry. For example, the V1 Method looks at the trend on both the 1-day and 1-hour charts before checking momentum on the 30-minute chart. The idea is simple: trade in the direction of the bigger trend, not against it.
Trend, Support and Resistance
A trend is the general direction of price. In an uptrend, prices make higher highs and higher lows: each peak is higher than the last, and each dip is higher than the last. In a downtrend, the opposite happens. In a sideways market, price moves back and forth in a range with no clear direction. Many beginners lose money by buying in a downtrend because a coin looks cheap, or by selling in an uptrend because they are afraid. Checking the trend first helps you avoid that.
Support is a price level where buyers have stepped in before and price has bounced up. Resistance is a level where sellers have stepped in and price has turned down. These levels are not magic lines. They are areas where many traders are watching the same price, so they often matter, but they can also break. When price breaks through resistance and stays above it, that old resistance can become new support. When it breaks below support, that support can become new resistance.
Volume and Indicators
Volume shows how much of a coin was traded during each candle. High volume on a big move suggests many traders agreed with that move. Low volume on a big move suggests the move may be weak. Volume alone does not tell you to buy or sell, but it helps you judge how strong a move is.
Indicators are calculations based on price, and the most common one for beginners is the RSI, the Relative Strength Index. It is a number from 0 to 100. As the Scalprbot course explains, an RSI below 30 often means a coin has been sold heavily, and an RSI above 70 often means it has been bought heavily. RSI does not predict the future. It describes the recent past. Use it to confirm what you already see in price and trend, not as a signal on its own.
Risk Disclaimer
Crypto trading is risky. This article is for education only and is not financial advice. You can lose money. Do your own research.